The early computer programmers in the 1940s believed that programming would be a straightforward process: hard thinking, writing a program, and nothing else. The reality was revealed to them just several years later. In June 1949, the creator of the first stored-program computer EDSAC, Maurice Wilkes, could not have his code run due to 20 errors in his 126 lines long program. At that moment, Wilkes realized that his programming routine would consist of finding errors or bugs in his programs. The process of developing the most effective debugging techniques began.
And now it is time for us to unbox the best solutions for debugging in 2024.
written by:
Mihail Gerasimenko
Project Manager
Contents
To Debug or Not to Debug?
This age-old question has divided programmers for years. Some believe that debugging should be done as early and as often as possible. Others prefer not to debug their code until it’s complete. So what is the right approach? Today’s developers can’t afford to risk code quality by putting off debugging until later. Modern projects are much more complex, and the code is far longer than Maurice Wilkes’s 126-line work. By detecting errors throughout the development stage, programmers can fix them early on, before they spread and cause new problems.
Bugs are sneaky, eely, and tricky. They can damage even the systems bearing such loud names as Google. In 2019, the tech giant shut down its ambitious social network project Google+ and deleted all the accounts. In 2015–2018, Google+ profile personal data remained potentially open to outside developers due to a fatal security bug in Google+ API. The bug resulted in exposing user data from more than 50 million accounts. The only way out for the company was to pull the plug out for the whole project. Should we be scared of potential bugs? Definitely not!
Debugging Techniques We Recommend
Developers and bugs are, actually, like each other's shadows. Knowing the best debugging techniques is crucial for the top-quality software development process, no matter how confident a software developer is in writing perfect, clean code. We offer you our review of reliable debugging methods to bear in mind.
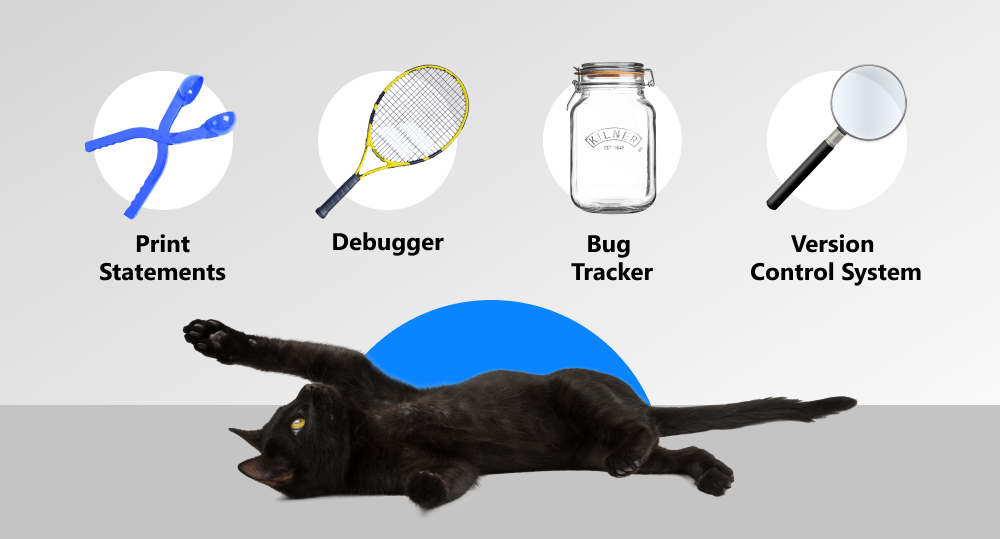
Divide and Rule with Print Statements
The first debugging technique has a long history and many names: tracing, printf() debugging, classic debugging, or even caveman, old-school, or "Hey, mom!" debugging. The method allows augmenting code with log statements to observe from your computer. The technique requires adding trace functions and enabling definitions to get information about the code.
Even though tracing has been used since the times when many modern languages did not exist, it is still very effective for debugging concurrent programs with real-time constraints, like UI interactions. Well-positioned print statements enable tracing the flow of data within a piece of code, thus identifying the source of the bug. And it's high time for us to turn to more advanced debugging techniques.
Automate with a Debugger
Another essential tool in a developer's arsenal is the debugger. This software program serves a critical purpose: testing and debugging target programs. As code executes, the debugger provides line-by-line analysis, allowing developers to pinpoint errors and understand where they went wrong. By running code under controlled conditions, it speeds up bug identification and resolution. What about examples?
GDB (The GNU Debugger) enables a developer with facilities for tracing and altering the execution of a program. The portable debugger runs on a range of Unix-like systems and works for several languages: C, C++, Go, Python, Rust, and others. GDB allows pursuing a process remotely and is developed for backend debugging. Unlike many other debuggers, GDB runs in the command line — no colorful interfaces for actual developers. The latest version GDB 11.1, released this September, has a lot of enhancements for Python, in Guile API, and many more.
IDA (Interactive Disassembler) is a debugger for reversing engineer machine-executable code into assembly-language source code. It allows cross-referencing code sections, API calls, and track parameters with no need to endure the compilation process. The commercial version of the debugger, IDA Pro 7.6, offers the latest features of the program. The earlier generations are free.
Sentry is a cross-platform debugger for the complex process of finding errors in any layer of an application — backend, frontend, or distributed servers. Sentry does automatic logging with breadcrumbs to trace the issues down and understand them. Moreover, backtracing along the released versions helps to see if the changes caused defects.
Take Note with a Bug Tracker
Found a bunch of bugs? Track them!
Today, developers can use a variety of bug tracking tools to meet the requirements of complicated projects. All bugs are managed and assigned to the right people. Bugs are transferred as issues, which provides a complete overlook of the debugging process for effective collaboration of developers, detailing important information on debugging and archiving bugs and their fixes. But what bug trackers are prevalent nowadays?
Backlog by Nulab is popular software for project management, and it offers simple, powerful, and robust code management for effective bug tracking. Backlog Bug Tracker is an excellent tool to identify and prioritize bugs and then fix them. The bug tracker provides members of the team with a high-level view of where exactly each bug is situated in the workflow to inform the team members about all code updates in real-time. Developers also appreciate the smooth and intuitive interface of Backlog.
Jira by Atlassian is designed for fast capturing, assigning, and prioritizing errors in software. Its robust workflow engine gives on-air reports of a bug's status within one issue for each bug. Jira Bug Tracker provides immediate control at all stages of development. Each issue with all its updates, assignments, and comments is trackable under the Jira activity log. A link option in issue fields is effective for collaborative bug tracking and fixing. Developers value the comprehensive functionality and high level of customization of Jira Bug Tracker, which is also great for Agile projects.
Make It Clear with a Version Control System
During the development process, code undergoes numerous changes. Somewhere, in those changes, bugs can sit tight. Version control systems are reliable operation methods for identifying errors in the multiple layers of code generations. The debugging technique of VCS allows overlooking the timeline of code variants and identifying the error's exact place. When a bug is captured, it is also possible to roll back the code to a previous version without this error. Thus, VCS provides the reverse debugging or backtracking strategy, saving a lot of time for development.
Git is the absolute leading version control system among developers: according to StackOverflow, 93% of professionals rely on Git. Linus Torvalds created it in 2005. The latest version, v2.39.0 of this open-source distributed VCS, was released in December 2022. It has become the Holy Grail for the developers' community, where every member is a valuable contributor. Git offers a set of excellent powerful options for debugging:
- the git blame command finds the commit responsible for the line with the error, and the author of that commit to get comments on the code;
- the git bisect command does an automatic binary search to figure out which commit initiated the bug, dividing the git commit-tree into good and bad ones;
- the git grep command effectively searches the project for a specified string or expression in the source code.
AI for Debugging
What else will help developers debug the code? Large tech companies like Intel Corp., Amazon.com Inc., and Microsoft Corp. are currently developing AI-powered tools for debugging. These solutions will be able to analyze millions of code lines, identify and flag errors, and suggest best practices for fixing.
Wrap-Up
So, you see that debugging at scale plays a significant part in developing modern complex projects. The innovative debugging techniques we told you about help trace errors, provide clean code, and effectively coordinate the collaboration of development teams.
Visit our Services page to learn more about our top competencies in software development. And you are always welcome to contact our professionals for any further comments.

Contacts
Feel free to get in touch with us! Use this contact form for an ASAP response.
Call us at +44 151 528 8015
E-mail us at request@qulix.com


